
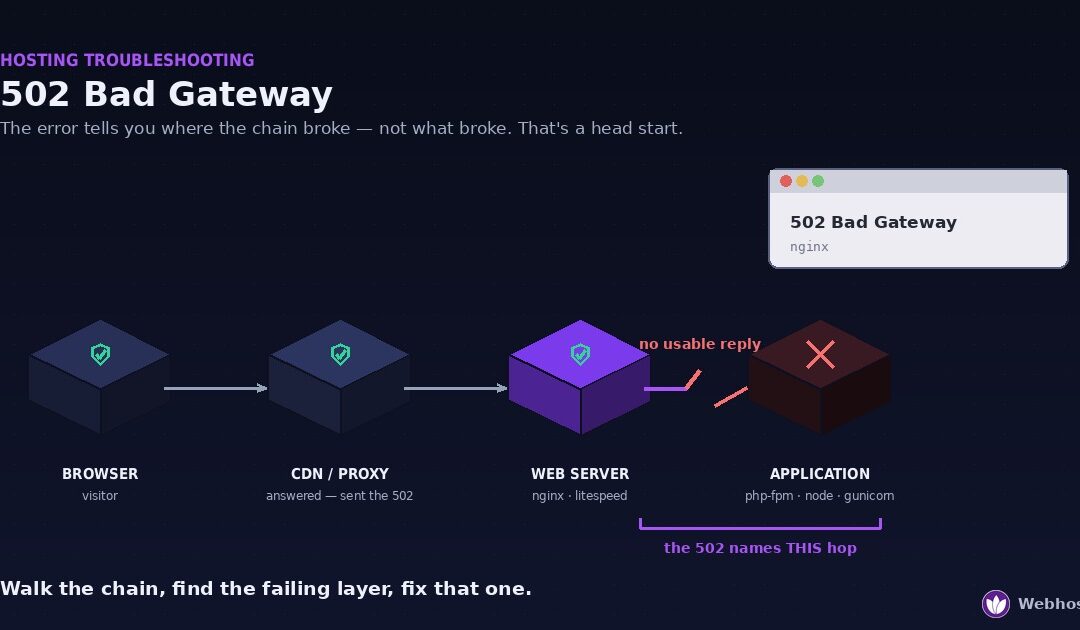
A 502 Bad Gateway means a proxy sitting in front of your website asked the server behind it for a page and got back something broken — or nothing usable at all. The proxy itself is working fine; the layer behind it is not. Four causes account for nearly every case: a crashed application process, a server out of resources, a backend that answered too slowly, or a proxy pointed at the wrong place.
The useful thing about a 502, and the reason it is less frustrating than it looks, is that it tells you where the failure is. Not what broke — but which hop in the chain between your visitor and your content stopped working. That is a genuine head start, and most articles on this error throw it away by opening with advice aimed at visitors: refresh the page, clear your cookies, try a different browser. None of that can fix a server-side error, and if you own the site, none of it is your problem to try.
So this guide is written for the person responsible for the site. First we walk the request chain to identify the failing layer, then we fix that layer. Same approach our engineers take on a 502 ticket, and the same one we used in the database connection error guide: diagnose once, fix once.
What a 502 Actually Tells You
To read a 502, you need a picture of what sits between a visitor and your website. Modern sites are not one server answering requests; they are a short chain of them, each handing the request along.
The browser asks for a page. A CDN or edge proxy usually answers first — Cloudflare, Bunny, or your host’s edge network — serving cached content when it can and forwarding the request when it cannot. A web server receives that forwarded request: Nginx, LiteSpeed, or Apache. And behind it, an application actually builds the page: PHP-FPM for WordPress, or Node, Gunicorn, Puma, or similar for other stacks. The page travels back down the same chain.
A 502 is what a link in that chain says when the link behind it fails. In the formal definition, the 502 status code is returned when a server acting as a gateway or proxy receives an invalid response from the upstream server it was trying to reach. Read that carefully, because it contains the whole diagnosis: the thing that sent you the 502 is working — it is reporting on something it could not get a sensible answer from.
That makes a 502 meaningfully more informative than its neighbours, and the three are worth separating:
500 Internal Server Error — the application ran and failed. Your code threw an error. The failure is inside the thing that builds the page.
502 Bad Gateway — a proxy got a reply it could not use: a connection refused, a connection dropped mid-response, or garbage where HTTP headers should be. The layer behind the proxy is broken or absent.
504 Gateway Timeout — the proxy got no reply at all within its waiting period. The layer behind it is alive but too slow, or hung.
In practice 502 and 504 blur together, because a backend that dies mid-request and a backend that never answers can produce either depending on the proxy’s configuration and where in the exchange things fell apart. Treat them as neighbours: the section on timeouts below applies to both.
One more thing the error tells you, and it is the reason the next section exists. Because a 502 is generated by a middle layer, which middle layer generated it narrows the problem immediately. A Cloudflare-branded 502 page came from Cloudflare — meaning the edge could not get a usable response from your origin. A plain, unstyled 502 came from your own web server — meaning Nginx or LiteSpeed could not get one from your application. Same status code, two completely different investigations, and you can tell them apart by looking at the page.
First: Find Out Which Layer Failed
Four checks, two minutes, no configuration changes. As with any outage, the goal is to stop guessing before you start fixing.
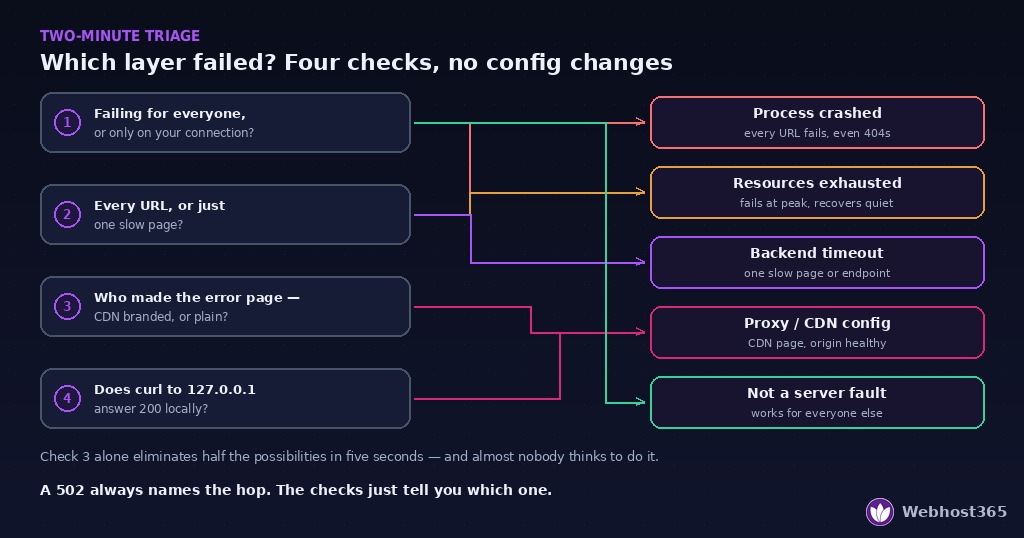
Check 1: Is it failing for everyone, or only for you?
Load the site on a different network — mobile data rather than office Wi-Fi — or ask someone elsewhere to try it.
If it works for them, the error is not really a 502 from your infrastructure; you are looking at a local networking problem, a VPN, or a proxy on your own connection. That is the one case where the visitor-focused advice everyone else publishes actually applies. If it fails for everyone, it is server-side and yours to solve, and the remaining checks narrow it down.
Check 2: Does every URL fail, or just some?
Try the homepage, then a deep page, then something that certainly does not exist, like yoursite.com/nothing-here.
Everything fails, including the 404 path — the application behind your web server is not answering at all. That points hard at a crashed or stopped process, Cause 1 below.
Most pages work but a specific one 502s — the application is running fine and one particular request is breaking it: a slow report, a heavy search, an import, an endpoint calling a stalled external API. That points at timeouts, Cause 3.
It works, then fails, then works — nothing is broken outright; something is exhausted. That points at resources, Cause 2.
Check 3: Who generated the error page?
Look at the 502 page itself.
If it carries CDN branding — a Cloudflare ray ID, a provider logo, a styled error page — the edge produced it, and the meaning is specific: your CDN could not get a usable response from your origin server. That could be the origin genuinely being down, but it is just as often a firewall blocking the CDN’s IP ranges or an origin DNS record pointing somewhere stale. Cause 4.
If the page is plain and unstyled, usually just the words “502 Bad Gateway” and a server name, your own web server produced it. The break is between Nginx or LiteSpeed and the application behind it — Causes 1, 2, or 3.
This one check eliminates half the possibilities in about five seconds, and almost nobody thinks to do it.
Check 4: Ask the origin directly
If you have shell access, take the proxy out of the picture and see whether the server answers for itself:
bash
curl -I http://127.0.0.1/            # the web server, from the server itself
curl -I http://127.0.0.1:8080/       # or whatever port your app listens on
A 200 from the origin while the public URL still 502s means the origin is healthy and the problem lives at the edge — the CDN cannot reach it, which is Cause 4 again. A 502 or a refused connection locally means the fault is right there on the box, in the application layer, and Causes 1 through 3 are where to look.
Reading your four answers
| What you observed | Most likely cause | Go to |
|---|---|---|
| Every URL fails, including non-existent paths | Application process down | Cause 1 |
| Fails and recovers with traffic; intermittent | Resources exhausted | Cause 2 |
| One slow page or endpoint 502s, rest are fine | Backend timeout | Cause 3 |
| CDN-branded error page; origin answers locally | Proxy or CDN misconfigured | Cause 4 |
| Only fails on your connection | Local network, VPN, or proxy | Not a server fault |
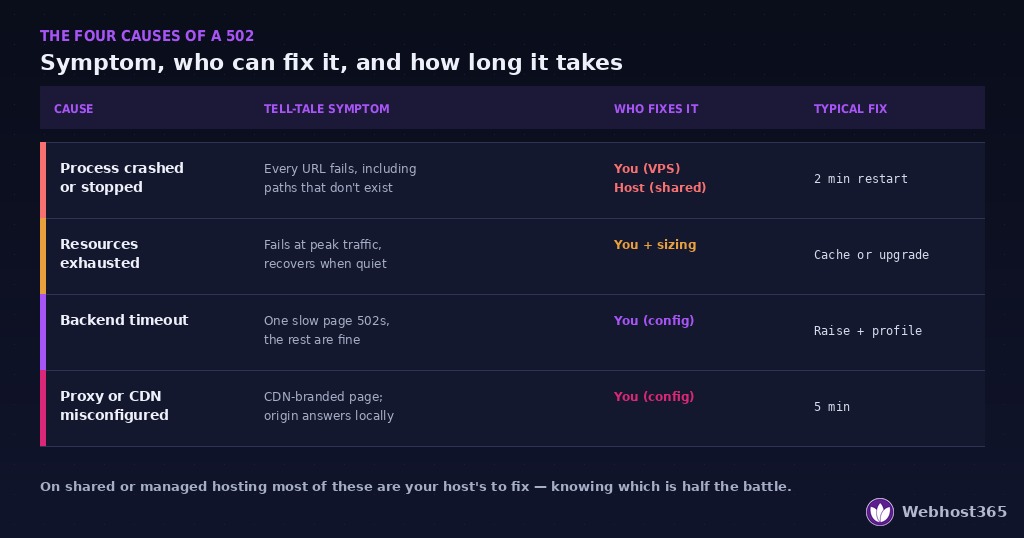
If two rows fit, start with Cause 1 — it is both the most common and the fastest to confirm. And if you are on shared or managed hosting where you cannot run any of these commands, skip ahead to the host’s-fault section: on that kind of plan, most of what follows is not yours to fix, and knowing what to ask is worth more than another hour of trying.
Cause 1: The Application Process Crashed or Stopped
This is the most common 502 and the fastest to confirm. Your web server is running — it answered, which is why you got a 502 rather than nothing — but the application it forwards requests to is not there. PHP-FPM has stopped, your Node process exited, Gunicorn died, the container is restarting. Nginx knocks, nobody answers, and 502 is the only honest thing it can report.
The tell from Check 2 is that everything fails, including URLs that do not exist. A missing page still requires the application to run and produce a 404; when even that returns 502, nothing behind the proxy is answering.
Confirm it in one command
Check whether the service is running:
bash
systemctl status php-fpm # or: nginx, node-app, gunicorn — whatever serves your appactive (running) means it is up and you should move to Cause 2 or 3. Anything else — inactive, failed, or a restart loop where the uptime resets every few seconds — is your answer.
Let the proxy tell you what it saw
The web server’s error log records the exact failure, and it is usually one unambiguous line. This is the most valuable ten seconds in the whole investigation:
bash
sudo tail -30 /var/log/nginx/error.logWhat you are looking for:
connect() failed (111: Connection refused) while connecting to upstream — nothing is listening on the address the proxy is trying. The process is genuinely down.
connect() to unix:/run/php-fpm.sock failed (2: No such file or directory) — the socket the proxy expects does not exist, usually because the service that creates it is not running.
connect() to unix:/run/php-fpm.sock failed (13: Permission denied) — the process is running and the socket exists, but the web server user cannot open it. That is a permissions problem, not a crash — jump to Cause 4.
upstream prematurely closed connection while reading response header — the application accepted the request and then died partway through answering. Something killed it mid-request, which usually means memory: see Cause 2.
Restart, then find out why
Getting the site back is the easy half:
bash
sudo systemctl restart php-fpm
sudo systemctl status php-fpm     # confirm it stayed up
The site should recover immediately. But a service that stopped on its own will stop again, so the more important question is what killed it. Two places hold the answer — the service’s own journal, and the kernel:
bash
sudo journalctl -u php-fpm --since "1 hour ago" | tail -40
sudo dmesg -T | grep -i -E "killed process|out of memory" | tail -10
If dmesg shows an out-of-memory kill, you have not found a crash — you have found a symptom of Cause 2, and restarting only resets the clock. If the journal shows a fatal configuration error, the process failed to start after a change and the fix is in the config, not the restart. And if the process is cycling — running, dying, restarting every few seconds — the site will flicker between working and 502ing, which looks like an intermittent fault but is not.
On shared or managed hosting none of these commands are available to you, and that is fine. The relevant section for you is the host’s-fault section below, because on that kind of plan a stopped application process is entirely theirs to notice and restart.
Cause 2: The Server Ran Out of Resources
Here nothing crashed in any dramatic sense. The application is running, the config is correct, and requests still fail — because there is no capacity left to serve them. This is the 502 that arrives during your busiest hour and disappears by the time you have finished reading about it.
Two different ceilings, one error
The worker pool is full. PHP-FPM, Gunicorn, and their equivalents run a fixed number of worker processes, each handling one request at a time. When every worker is busy and the queue is full, new connections are refused, and a refused connection is a 502. Nothing is broken; the pool is simply too small for the traffic, or each request is taking too long and workers are not freeing up fast enough.
Memory ran out. The server exhausted its RAM and the kernel started killing processes to survive. It usually chooses the largest one, which is often exactly the application you need. Then the proxy’s next request is refused, and you get a 502 — with the true cause recorded not in your application log but in the kernel’s.
Recognising it
The signature is correlation with load. The site fails at peak and recovers when things quiet down. Refreshing works sometimes. It started the week traffic grew, or when a campaign went out, or when a crawler discovered your site. Nothing was deployed and nothing was changed — the load simply exceeded what the box could serve.
Confirm with the kernel:
bash
sudo dmesg -T | grep -i "out of memory" | tail
free -h
An OOM entry naming your application is conclusive. If free -h shows almost no available memory and swap in heavy use during normal operation, you are running at the edge and any spike will tip it over.
For the worker-pool version, look at the pool’s own log — for PHP-FPM, a line about the server reaching pm.max_children is a direct statement that the pool is the ceiling:
bash
sudo grep -i "max_children" /var/log/php-fpm/error.log | tailWhat actually fixes it
Three moves, in order of how much they give back for the effort.
Reduce the work per request. Most sites hitting this ceiling are doing far more work per page than they need to. A page cache means the vast majority of visitors never invoke the application at all, and for WordPress specifically, Redis object caching removes the repeated database queries that keep workers busy. A site that 502s at 200 concurrent visitors uncached will often handle several thousand cached without touching a single setting.
Right-size the worker pool. More workers is not automatically better: each one consumes memory, and a pool sized beyond what your RAM supports converts a 502 into an out-of-memory kill, which is worse. Size the pool to available memory divided by the average worker’s footprint, leaving real headroom for the database and the operating system.
Add capacity, if the load is real. When the traffic is legitimate and caching is already in place, the honest answer is that the server is too small. Our RAM guide and calculator and the WordPress requirements by traffic level will tell you what your actual numbers need, and moving to business hosting or a VPS with dedicated resources raises the ceiling properly rather than shaving the symptom.
One thing worth saying plainly: intermittent 502s under load are a warning, not a mystery. They are the server telling you, ahead of time, that its ceiling is now inside your normal traffic range. Sites that ignore that message reliably meet it again on their busiest day of the year.
Cause 3: The Backend Was Too Slow
Sometimes nothing is down and nothing is exhausted — the application simply takes longer to answer than the proxy is willing to wait. The proxy gives up, closes the connection, and reports a gateway error. Strictly this is more often a 504 than a 502, but in practice you will see both, because whether the proxy has received a partial response before it gives up decides which code it emits. The diagnosis and the fix are the same either way.
The tell from Check 2 is specific: most of the site works, and one particular thing fails. A report that aggregates a year of orders. A search across a large catalogue. An import. A checkout step that calls a payment API which is itself having a bad day. Anything whose work is measured in tens of seconds rather than milliseconds.
The chain of ceilings
The reason this is confusing is that a single request passes several independent timeouts, and the first one to expire wins. A typical WordPress stack has at least three:
| Layer | Setting | Common default |
|---|---|---|
| CDN / edge | Provider’s origin timeout | 100 seconds |
| Nginx → PHP-FPM | fastcgi_read_timeout | 60 seconds |
| Nginx → any upstream | proxy_read_timeout | 60 seconds |
| PHP itself | max_execution_time | 30 seconds |
Nginx’s own proxy module documentation defines proxy_read_timeout as the wait between two successive reads from the upstream — not a total request budget, which is a distinction that trips people up: a backend streaming output slowly will never trip it, while one that goes quiet for 61 seconds will.
The practical rule is that these ceilings must be ordered sensibly, from the inside out. If PHP is allowed 30 seconds but Nginx waits 60, a long request dies inside PHP and you get a clean application error you can debug. Reverse them — Nginx giving up at 30 while PHP is still allowed 60 — and the proxy kills a request that was going to succeed, producing a gateway error with nothing useful in any log. That inversion is a surprisingly common cause of mysterious intermittent 502s after someone has “tuned” a config.
Raising a timeout, carefully
If a legitimately slow operation is being cut off, raise the relevant ceiling — scoped to the path that needs it, not globally:
nginx
location /admin/export/ {
    proxy_pass http://127.0.0.1:8080;
    proxy_read_timeout 300s;
}
Then test the configuration before reloading, and reload rather than restart so in-flight requests are not dropped:
bash
sudo nginx -t && sudo systemctl reload nginxNow the warning that belongs with every timeout change: raising a timeout does not fix anything. It stops the proxy reporting the problem. A page that takes four minutes to build is a page nobody will wait for, and a request holding a worker for four minutes is a worker unavailable to everyone else — which is how a timeout problem quietly becomes the resource problem from Cause 2. Raise the ceiling to stop the bleeding, then go and find out why the operation is slow: a missing database index, an unbounded query, an external API without its own timeout, or work that should be running on a schedule rather than while a visitor waits.
The best fix for a slow endpoint is almost always to stop doing the work in the request at all. Move it to a background job or a scheduled task, return immediately, and let the result be fetched when it is ready.
Cause 4: The Proxy Is Pointing at the Wrong Place
The last cause is configuration, and it has a distinctive signature: it appears immediately after a change. A deploy, a config edit, a server migration, a DNS update, a new CDN. Nothing crashed and nothing is overloaded — the proxy is simply asking the wrong door, or is not allowed through the right one.
Wrong address, port, or socket
The proxy has an upstream address written in its config, and if that address is wrong, every request fails identically. The log from Cause 1 names it precisely: connection refused on a port means nothing is listening there; no such file or directory on a socket path means the path is wrong or the socket is not being created.
Check what the application is actually listening on and compare it against what the proxy expects:
bash
sudo ss -tlnp | grep -E "8080|9000"      # TCP ports
ls -l /run/php-fpm/*.sock                 # sockets
grep -rn "proxy_pass\|fastcgi_pass" /etc/nginx/
A mismatch between those two answers is your bug. This is the single most common post-deploy 502: the app moved to a new port, or a package update changed the socket path, and the proxy config still describes the old world.
Socket permissions
The subtler version, and the one that looks impossible until you know it: the socket exists, the application is running, and the proxy still cannot connect. The error log says permission denied.
Unix sockets have owners. PHP-FPM’s pool config specifies who owns the socket it creates, and if that does not match the user the web server runs as, the web server is refused at the door. Check both, and align them:
bash
ls -l /run/php-fpm/www.sock          # who owns the socket
ps aux | grep -E "nginx: worker"     # who nginx runs as
The CDN cannot reach your origin
If Check 3 showed a CDN-branded error page while the origin answered fine locally, the break is at the edge. Three usual culprits.
The origin firewall is blocking the CDN. Edge networks connect from their own IP ranges, and a firewall rule, a new fail2ban ban, or a security plugin can block them. From the origin’s point of view a CDN looks like a large volume of requests from a handful of addresses — which is also what an attack looks like. Allowlist your CDN’s published ranges.
The origin DNS record is stale. The CDN needs to know where your real server is. After a server move, if the origin record still points at the old address, the edge is faithfully asking a machine that no longer serves your site.
The origin’s TLS certificate is invalid or expired. If your CDN connects to the origin over HTTPS and that certificate has expired or does not match, the connection fails and the edge returns a gateway error rather than a certificate warning. Our SSL error guide covers checking and renewing the origin certificate.
All three share the same fingerprint: your server is perfectly healthy, and only the public path is broken. Our reverse proxy explainer covers how that layer works in more depth if the architecture is new to you.
The reassuring thing about this whole cause is that configuration problems, unlike resource problems, stay fixed. Once the proxy is pointing at the right place with the right permissions, it will keep doing so — and the fastest way to prevent this category entirely is to make nginx -t part of your deploy, so a broken config is caught at release time rather than by your visitors.
When It Is Your Host’s Fault (And What to Ask Them)
If you are on shared or managed hosting, almost everything above is out of your reach. You cannot restart PHP-FPM, read the Nginx error log, or change a timeout. That is not a gap in this guide — it is the deal you signed: the host runs the stack so you do not have to. It does mean that when a 502 appears, your job is not to fix it but to get it fixed quickly, and that is a different skill.
How to tell it is not yours to fix
You did not deploy anything. No code push, no plugin update, no config change — and the site stopped. Configuration does not drift on its own; something changed on the other side of the wall.
It affects every site on the account. One application crashing is a bug. Every application on the server failing at once is the server.
The origin is healthy but the public URL is not. If you can reach the site by any route that bypasses the edge while visitors cannot, the break is in infrastructure you do not administer.
It recovers by itself. A 502 that clears after fifteen minutes with no action from you was fixed by someone else — or by a process restarting on its own. Either way it will recur until the cause is addressed, so the ticket is still worth opening.
The three questions to put in your ticket
Same three that work for any outage, adapted to this error:
- Was there an interruption to the application or web server layer on my account in the last [timeframe]? Specific, time-bounded, answerable from monitoring.
- Is my account hitting worker, memory, or process limits — and can you show me the numbers? This separates a platform fault from a site that has outgrown its plan. Insist on the figures; a ceiling you cannot see is one you cannot plan around.
- If this was server-side, what caused it and what stops it recurring? The question that distinguishes a restart from a fix.
Give them the exact times, the affected URLs, whether other sites were down, and what you already ruled out. A ticket showing you did the four checks from Section 2 skips the first twenty minutes of any support conversation.
What good looks like
A total outage should be acknowledged in minutes. Your host should be able to say in one reply whether the fault was theirs, and if it was, explain what happened rather than reporting that they “restarted the service, please check now.” If the cause was your account hitting limits, you should receive the actual numbers and a specific recommendation rather than a nudge toward the next plan up.
What you should not accept: repeated restarts with no explanation for a recurring outage, being asked to reinstall your site when the application layer is down, or silence during a total outage. We hold ourselves to the same standard — our support team answers around the clock, and when the fault is ours we say so and explain it, because an outage you understand is survivable and one you are managed through is not.
Preventing 502s
Four measures, and they matter more than any single fix above, because they turn this error from an outage into a non-event.
Supervise the process. Any application serving requests should restart automatically when it dies. A systemd unit with Restart=always turns a crash into a two-second blip that nobody sees, instead of a 502 that lasts until someone notices. Our Linux VPS hardening guide covers service management alongside the security basics.
Size the pool to the memory you actually have. Worker counts inherited from a tutorial are the most common cause of the memory kills behind Cause 2. Work out how much memory one worker really uses under your load, leave room for the database and the system, and set the pool from that number rather than from a round figure.
Monitor the 502 rate, not just uptime. Uptime checks hit your homepage every few minutes and will happily report green through an outage affecting every other page. Watching the rate of gateway errors catches the intermittent version — the one that quietly precedes a full outage by a week. Our uptime monitoring guide covers the checks that catch it.
Test deploys on staging, and validate config before reload. Most configuration 502s ship with a deploy. A staging site catches the application-level surprises, and making nginx -t a required step before any reload catches the rest. A broken config found at release time costs a minute; found by visitors it costs an outage.
Final Thoughts
The short version: a 502 tells you where, not what. Something in the middle of the chain asked the layer behind it for a page and got a broken answer. Spend two minutes identifying the failing hop — does everything fail or only some URLs, did a CDN or your own server generate the error page, does the origin answer when you ask it directly — and one of four causes will be obvious: a crashed process, an exhausted server, a timeout, or a proxy pointing at the wrong place. Then fix that layer, and only that layer.
And if you cannot run any of these commands because your host runs the stack, that is a legitimate answer rather than a dead end. Open a ticket with the three questions above and the times involved. On managed hosting the layer that failed is the layer somebody else agreed to keep running — including here.
Not sure a 502 is even what you have? Start with the 5-minute site-down diagnosis and let it route you.
FAQ
Almost always the website’s. A 502 is generated by a server acting as a gateway when the server behind it returns an invalid response, so the failure is on the site’s infrastructure rather than in your browser. The one exception is when the site works for everyone else and fails only for you, which points at a local network, VPN, or proxy issue. If you are the site owner, treat every 502 as server-side and start by identifying which layer of your stack failed.
A 502 Bad Gateway means the proxy received a response it could not use — a refused connection, a dropped connection, or malformed data. A 504 Gateway Timeout means it received no response at all within its waiting period. In practice the two blur, because a backend that dies partway through answering can produce either depending on the proxy’s configuration. The diagnosis overlaps: 502 points at a broken or absent backend, 504 at one that is alive but too slow.
Occasionally, and it is worth one attempt. If the cause is a process that restarts automatically, a load spike passing, or one unhealthy server behind a load balancer, a refresh a few seconds later may succeed. But a refresh cannot fix a crashed application, an exhausted server, or a misconfigured proxy — and if you own the site, refreshing tells you something useful anyway: a 502 that comes and goes points at resources, while one that never clears points at a stopped process or a config error.
Yes, and the error page usually says so. If the 502 page carries CDN branding or a ray ID, the edge generated it, meaning the CDN could not get a usable response from your origin server. Common causes are the origin firewall blocking the CDN’s IP ranges, a stale origin DNS record after a server move, or an expired TLS certificate on the origin. The tell is that the server answers fine locally while the public URL fails.
Intermittent 502s almost always mean resource exhaustion rather than a broken configuration. Configuration is either right or wrong; it does not work every third request. When failures correlate with busy periods and clear when traffic drops, the worker pool is saturating or memory is running out at peak. The other cause of intermittency is a process stuck in a restart loop, which makes the site flicker between working and failing every few seconds.
If you control the server, minutes: a stopped process restarts immediately, and a config error is fixed as fast as you can find the mismatch. The longer work is preventing recurrence — right-sizing the worker pool or resolving whatever exhausted memory. On managed hosting, a total outage should be acknowledged within minutes and explained in the first reply, even if the underlying fix takes longer.