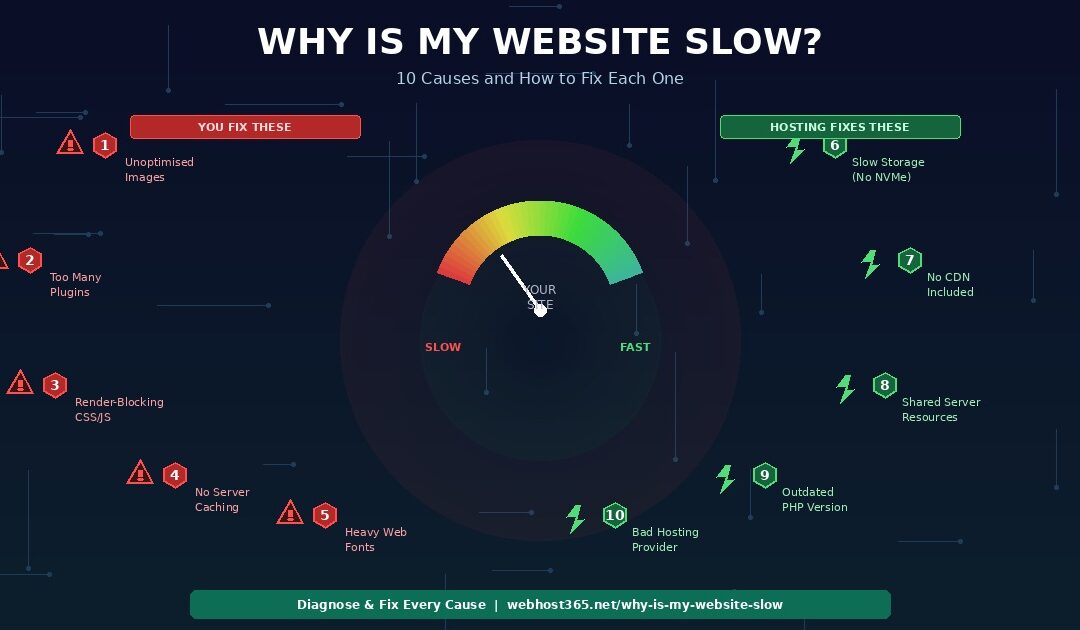
Your website is slow because of one or more of these ten fixable problems: unoptimised images that are too large for the screen they display on, too many plugins or third-party scripts loading on every page, render-blocking CSS and JavaScript that delays content from appearing, no server-side caching so the server rebuilds every page from scratch for every visitor, heavy or unused web fonts downloading on every page load, slow storage hardware on your hosting server, no CDN so visitors far from your server wait for data to travel thousands of kilometres, shared server resources that throttle your site when neighbouring accounts have traffic spikes, an outdated PHP version running your WordPress or CMS slower than it should, or a hosting provider whose infrastructure simply cannot deliver the speed your site needs regardless of how well you optimise it.
Five of those causes live inside your website. You control them. They are fixable with image compression, plugin management, code minification, caching configuration, and font optimisation. The other five live underneath your website, in the hosting infrastructure your provider gives you. They are fixable only by choosing hosting that runs on the right hardware with the right network and the right configuration.
This guide walks through each cause in order of impact, shows you how to diagnose whether it applies to your site using free tools, and gives you the specific fix for each one. Every diagnosis uses either Google PageSpeed Insights or GTmetrix, both free, both available to anyone, and both capable of telling you exactly what is slowing your site down before you change a single thing.
If you have already compressed your images, minified your code, removed unnecessary plugins, and enabled a caching plugin and your site is still slow, skip directly to cause number six. The answer is almost certainly your hosting infrastructure — and no amount of front-end optimisation will fix a server that responds slowly because it runs on outdated hardware with no CDN and shared resources that throttle during peak hours.
How to diagnose your speed problem (before you fix anything)
Before changing anything on your website, measure it. Two free tools will tell you exactly which of the ten causes below apply to your site, and they will save you from spending hours fixing problems you do not have while ignoring the one problem that is actually responsible.
Google PageSpeed Insights analyses your page and gives you scores for each Core Web Vital: Largest Contentful Paint (how quickly your main content appears), Interaction to Next Paint (how quickly your site responds to clicks and taps), and Cumulative Layout Shift (how stable your layout is while loading). It also lists specific recommendations with the exact files and resources causing each issue. Run your homepage and your slowest page through PageSpeed and note which recommendations appear. Those are your causes.
GTmetrix gives you something PageSpeed does not: a waterfall chart. The waterfall shows every single file that loads when someone visits your page — every image, every CSS file, every JavaScript file, every font, every third-party script — in the exact order they load, with the exact time each one takes. The waterfall tells you not just that your page is slow, but precisely which files are responsible and how much time each one adds.
When you look at your results, focus on three numbers. Time to First Byte (TTFB) tells you how fast your server responds. If TTFB is above 600 milliseconds, the problem is your hosting infrastructure, not your website content — skip to cause six. Total page weight tells you how much data the visitor’s browser needs to download. If page weight is above 3 MB, your content is too heavy — start with cause one (images). Total number of requests tells you how many individual files the browser needs to fetch. If requests exceed 80, you have too many scripts and plugins loading — start with cause two.
These three numbers separate front-end problems from infrastructure problems immediately. A page with 150 KB total weight but 800ms TTFB has a hosting problem. A page with 80ms TTFB but 6 MB total weight has a content problem. A page with high TTFB and high weight has both, and you fix the infrastructure first because front-end optimisation cannot compensate for a slow server.
Run both tools now, before reading further. The results will tell you which of the following ten sections to pay attention to and which ones you can skip.
Front-end causes (things you control on your site)
These five causes live inside your website — your images, your code, your plugins, your fonts, your caching configuration. You can fix every one of them without changing hosting providers, without contacting support, and without spending any money. Start here because these fixes are free, immediate, and often deliver the largest speed improvements.
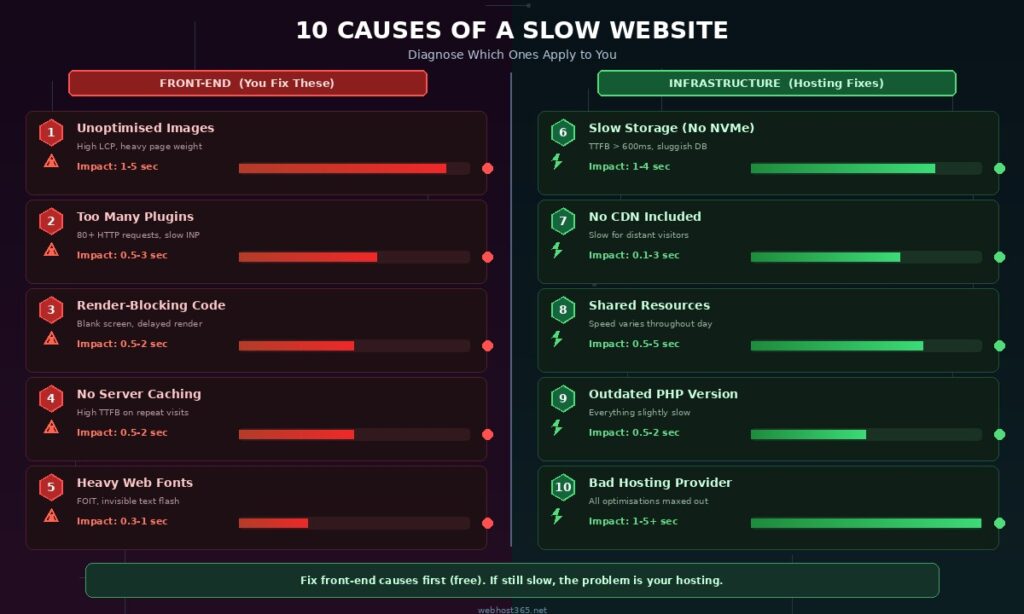
Cause #1: Unoptimised images (impact: 1–5 seconds)
Images are the single most common cause of slow websites and typically the single highest-impact fix. A page with ten uncompressed JPEG images at 500 KB each loads 5 MB of image data before anything else. The same ten images compressed to WebP format at 50 KB each load 500 KB — a 90% reduction that typically cuts 2 to 4 seconds off the page load time with no visible quality difference.
How to diagnose it: Run your page through PageSpeed Insights and look for two specific recommendations: “Serve images in next-gen formats” and “Properly size images.” Then check your GTmetrix waterfall for any image file above 200 KB. If you see multiple large images loading before the main content appears, they are directly inflating your Largest Contentful Paint (LCP) score.
How to fix it: Convert every image to WebP format, which delivers 30 to 50 percent smaller files than JPEG at equivalent visual quality. Resize images to their actual display dimensions — a 4000 pixel wide photo displayed at 800 pixels wide is downloading 5 times more data than necessary. Add lazy loading to every image below the fold so the browser only downloads images as the visitor scrolls to them rather than loading everything upfront. If you run WordPress, install a plugin like ShortPixel or Imagify that compresses and converts images automatically on upload. If you build your site manually, run images through a tool like Squoosh before uploading.
Why it matters for your business: Google’s LCP threshold for “good” Core Web Vitals is 2.5 seconds. A single unoptimised hero image at 1.2 MB can push your LCP past that threshold by itself, which means Google considers your page speed “needs improvement” and your search ranking takes a hit — all because of one image. For a complete guide to image optimisation and every other WordPress speed fix, see our article on how to speed up your WordPress site.
Cause #2: Too many plugins or scripts (impact: 0.5–3 seconds)
Every plugin on your WordPress site loads its own CSS files, JavaScript files, and sometimes makes external requests to third-party servers. A single plugin might add one or two HTTP requests. Twenty plugins can add 40 or more. Each request takes time to initiate, process, and download, and many of them block the page from rendering until they complete.
Third-party scripts are equally problematic. Your analytics tracker, your chat widget, your social media embeds, your ad platform, your A/B testing tool, your heatmap service — each one adds 100 to 500 milliseconds and runs JavaScript that competes with your own page content for the browser’s attention. A site with five third-party scripts can spend 1 to 2 seconds just loading tools that your visitors never see or interact with directly.
How to diagnose it: Count your active WordPress plugins in the dashboard. If you have more than fifteen, you almost certainly have redundancy. Then check your GTmetrix waterfall for third-party domains — any file loading from a domain that is not yours is a third-party script adding to your load time. PageSpeed Insights will flag specific scripts under “Reduce JavaScript execution time” and “Minimize third-party usage.”
How to fix it: Audit every active plugin. Ask a simple question for each one: does this plugin provide a function that directly serves my visitors or generates revenue? If the answer is no, deactivate and delete it. Replace multiple single-purpose plugins with one comprehensive solution where possible — a single SEO plugin replaces separate plugins for sitemaps, meta tags, and schema markup. Defer non-critical third-party scripts by adding the defer or async attribute so they load after your page content appears rather than blocking it. Every plugin you remove saves load time, reduces HTTP requests, and eliminates a potential security vulnerability.
Cause #3: Render-blocking CSS and JavaScript (impact: 0.5–2 seconds)
When a browser loads your page, it reads the HTML from top to bottom. If it encounters a CSS file or JavaScript file in the <head> section that does not have a defer or async attribute, it stops rendering the page entirely until that file is downloaded, parsed, and executed. The visitor sees a blank white screen during this wait. If multiple files are render-blocking, the blank screen persists for the cumulative time it takes to process all of them.
How to diagnose it: PageSpeed Insights lists render-blocking resources under the “Eliminate render-blocking resources” recommendation, including the exact file names, their sizes, and the estimated time each one adds. If you see this recommendation with a savings estimate above 500 milliseconds, it is worth fixing.
How to fix it: Minify your CSS and JavaScript files by removing whitespace, comments, and unnecessary characters. This reduces file size by 10 to 30 percent. Defer non-critical JavaScript using the defer attribute in the script tag so it loads after the page content is visible. Inline critical CSS — the styles needed for the above-the-fold content — directly in the HTML so the browser does not need to fetch a separate file before rendering the first screen. If you run WordPress, a plugin like Autoptimize or WP Rocket handles minification, deferral, and critical CSS generation automatically. These are one-time configurations that permanently reduce render-blocking without ongoing maintenance.
Cause #4: No server-side caching (impact: 0.5–2 seconds)
Every time a visitor loads a page on a WordPress site, the server executes PHP code, runs 20 to 50 database queries, assembles the HTML, and sends the result to the browser. If ten visitors load the same page in the same minute, the server does all of that work ten times and produces the same output every time. Without caching, your server is doing redundant work on every single request.
Server-side caching stores a pre-rendered copy of each page the first time it is generated. Every subsequent visitor who requests the same page receives the cached copy directly — no PHP execution, no database queries, no assembly time. The response drops from 200 to 500 milliseconds for a dynamically generated page to 10 to 50 milliseconds for a cached page.
How to diagnose it: Compare your TTFB on the first visit to a page versus the second visit to the same page. If both are equally slow, server-side caching is not working. If the second visit is dramatically faster, caching is active. You can also check by looking at your response headers in GTmetrix or browser dev tools for cache-related headers like X-LiteSpeed-Cache or X-Cache: HIT.
How to fix it: Enable a caching plugin appropriate for your server software. LiteSpeed Cache for LiteSpeed servers (the most efficient option because it integrates at the server level rather than the application level), WP Super Cache or W3 Total Cache for Apache or Nginx servers. On Webhost365 cloud hosting, LiteSpeed with LSCache is built into the server and activates automatically — no plugin configuration required. For a detailed walkthrough of caching setup and every other WordPress performance optimisation, see our complete guide on how to speed up your WordPress site.
Cause #5: Heavy or unused web fonts (impact: 0.3–1 second)
Custom web fonts add visual character to your website, but they come at a performance cost. Each font file is a separate HTTP request, and each file can range from 20 KB for a single weight to 200 KB or more for a full character set. A site loading three font families in four weights each (regular, italic, bold, bold italic) downloads up to twelve font files before the text is fully rendered.
The visible symptom is a Flash of Invisible Text (FOIT) — the page layout appears but all text areas are blank until the fonts finish downloading and the browser switches from invisible placeholder text to the actual styled text. Visitors see the structure of your page but cannot read a word until the fonts load.
How to diagnose it: Check PageSpeed Insights for “Ensure text remains visible during webfont load.” Check your GTmetrix waterfall for font files (usually ending in .woff2 or .woff) and count how many are loading. If you see more than four font files, you are likely loading weights you do not use.
How to fix it: Limit your site to two font families at most — one for headings and one for body text. Load only the weights you actively use. Most sites need only regular (400) and bold (700). Remove thin, light, medium, semibold, and extrabold weights unless your design specifically uses them. Add font-display: swap to your CSS font declarations so the browser shows text in a system font immediately while the custom font loads in the background, eliminating the invisible text flash entirely. If you use Google Fonts, consider hosting the font files on your own server rather than loading them from Google’s CDN — self-hosted fonts are cached by your own CDN and do not require an additional DNS lookup and connection to an external server.
Infrastructure causes (things your hosting controls)
If you have optimised your images, removed unnecessary plugins, minified your code, enabled caching, and trimmed your fonts — and your site is still slow — the problem is underneath your website. It is your hosting infrastructure. These five causes cannot be fixed with a plugin, a code change, or a settings tweak. They require better hosting hardware, a better network configuration, or a better provider. No amount of front-end optimisation will compensate for a server that is fundamentally too slow to deliver your pages quickly.
Cause #6: Slow storage hardware (impact: 1–4 seconds)
This is the most underdiagnosed cause of slow websites because most site owners never think about what type of storage their hosting server uses. They compare plans by storage size (10 GB, 50 GB, 100 GB) without asking about storage type — and the type determines speed far more than the size.
Your hosting server stores everything: your application files, your database, your images, your configuration. Every page load requires the server to read data from this storage. If the storage is slow, every read operation takes longer, and those delays compound across the dozens of file reads and database queries that a single page load generates.
Traditional hard drives (HDD) operate at approximately 130 MB/s with a latency of 5 to 10 milliseconds per read operation. Standard SATA SSDs operate at 550 MB/s with 0.1 milliseconds latency. NVMe SSDs operate at up to 7,000 MB/s with 0.02 milliseconds latency. A WordPress page generating 40 database queries spends 200 to 400 milliseconds waiting for an HDD, 4 milliseconds waiting for a SATA SSD, and 0.8 milliseconds waiting for NVMe. That is a 250x to 500x difference in storage wait time alone, before any other factor is considered.
How to diagnose it: Check your TTFB in GTmetrix or PageSpeed Insights. If TTFB is consistently above 600 milliseconds on uncached pages, your server is slow to respond. Then check with your hosting provider what storage type your plan uses. If they do not explicitly say NVMe, assume it is SATA SSD or worse. Many budget hosting providers still run HDD storage on their cheapest plans and do not disclose it prominently.
How to fix it: Move to a hosting provider that uses NVMe SSD storage on every plan. This is not an optimisation tweak. It is a hardware upgrade that reduces storage latency by 5x to 500x depending on what you are moving from. Webhost365 runs NVMe SSD on every plan from the $1.49 shared tier to VPS. There is no “upgrade to SSD” option because there is no non-NVMe option. The fastest storage available is the default configuration.
Cause #7: No CDN (impact: 0.1–3 seconds depending on visitor distance)
Your hosting server sits in one physical location — a data centre in one city in one country. When a visitor in that same city loads your page, the data travels a short distance and arrives quickly. When a visitor in a different country loads the same page, the data travels thousands of kilometres through dozens of network hops, and the delay is perceptible on every single request.
Without a CDN, a visitor in Mumbai loading a page from a server in Frankfurt experiences 150 to 250 milliseconds of network latency before a single byte of content arrives. That latency applies to the HTML page, every CSS file, every JavaScript file, every image, and every font. A page with 30 assets loading from a server 8,000 kilometres away accumulates significant latency across all those requests, even if each individual file is small.
A CDN caches your static content — images, CSS, JavaScript, fonts — on edge servers distributed around the world. A visitor in Mumbai receives cached content from a server in India. A visitor in São Paulo receives it from a server in South America. The origin server in Frankfurt only handles the initial page generation. Everything else comes from the nearest edge.
How to diagnose it: Run your site through GTmetrix from a test location far from your server. Then run it from a location near your server. If the load time difference is more than one second, CDN absence is a significant factor. Also check your analytics for visitor geography. If you have visitors in multiple countries and no CDN, those distant visitors are experiencing a meaningfully slower version of your site than local visitors.
How to fix it: Add a CDN to your hosting. You can configure Cloudflare’s free tier manually, which requires DNS changes and basic configuration knowledge. Or you can use a hosting provider that includes CDN automatically. Webhost365 includes Bunny CDN with 197 global edge locations on every plan at no extra cost and zero configuration. Your static assets are cached globally from the moment your site goes live. Most competitors either do not include a CDN or charge $5 to $15 per month for it as a paid add-on.
This cause is especially frustrating because it produces inconsistent symptoms. Your site loads fine at 6 AM, crawls at 2 PM, recovers at 8 PM, and slows down again the next afternoon. The speed problem appears and disappears without any changes on your part, and no amount of image compression or caching fixes it because the problem is not your site — it is your neighbours on the shared server.
On shared hosting, your website shares CPU, RAM, and storage I/O bandwidth with dozens or hundreds of other accounts on the same physical server. When those other accounts experience traffic spikes, run heavy database queries, or execute resource-intensive scripts, they consume resources that your site needs. The server has a finite amount of CPU and RAM to distribute, and when the total demand exceeds capacity, every site on the server slows down.
How to diagnose it: Run speed tests at different times of day over several days. If your TTFB varies by more than 200 percent between tests — fast at off-peak hours, slow during business hours — you are on a congested shared server. Also watch for intermittent 503 or 504 errors, which indicate the server is temporarily overwhelmed.
How to fix it: Upgrade to a hosting tier with dedicated resource allocation. On Webhost365 cloud hosting starting at $3.49 per month, your CPU and RAM are allocated exclusively to your account. Other accounts on the server cannot consume your resources regardless of their traffic patterns. Your site performs consistently at 6 AM and 2 PM because the resources powering it are yours alone. For a detailed comparison of when to stay on shared hosting versus when to upgrade, see our guide on cloud hosting vs shared hosting. If you need full server control beyond what cloud hosting provides, Linux VPS from $4.99 per month gives you root access and complete resource isolation with the option to configure every layer of the stack. For a comparison of those two options, see Linux VPS vs cloud hosting.
Cause #9: Outdated PHP version (impact: 0.5–2 seconds)
If your WordPress site feels uniformly sluggish — not one slow page but every page slightly slower than it should be — your PHP version may be the cause. PHP is the programming language that powers WordPress, WooCommerce, and the vast majority of CMS platforms. Each new PHP version includes performance improvements that make the same code execute faster without any changes on your part.
PHP 8.0 is approximately 20 to 30 percent faster than PHP 7.4 for typical WordPress workloads. PHP 8.2 and 8.3 are faster still, with additional optimisations for memory usage and function execution. Upgrading from PHP 7.4 to PHP 8.2 can reduce your page generation time by half a second or more per page load, which directly improves your TTFB and your Core Web Vitals scores.
The problem is that many hosting providers set PHP 7.4 as the default version when you create an account and never update it automatically. Your site runs on a four-year-old runtime indefinitely unless you manually switch to a newer version in your hosting control panel.
How to diagnose it: Check your PHP version in your hosting control panel. On most panels, this is in the PHP configuration or software section. If your version is 7.4 or lower, you are leaving significant performance on the table. You can also install the free “Display PHP Version” plugin in WordPress to see your version directly from the dashboard.
How to fix it: Switch to the latest stable PHP version — currently 8.2 or 8.3 — in your hosting control panel. The change typically takes effect within minutes. After switching, test your site thoroughly to ensure all plugins and themes are compatible with the new version. Most modern, actively maintained WordPress plugins support PHP 8.2 and above. If a plugin breaks on PHP 8.2, it is likely outdated, unmaintained, and should be replaced regardless of the PHP version you run. Webhost365 supports the latest PHP versions on all plans and makes version switching available through the control panel with no support ticket required.
Cause #10: Your hosting provider’s infrastructure is the ceiling
This is the cause that most website speed guides avoid mentioning directly because it requires the reader to consider switching hosting providers. But it is often the real answer, and pretending it is not does the reader no favours.
The symptom is distinctive. You have done everything else on this list. Your images are compressed to WebP. Your plugins are minimal and necessary. Your CSS and JavaScript are minified and deferred. Caching is enabled and working. Your fonts are limited to two families at two weights. Your PHP is updated to 8.2 or higher. And your site is still slower than it should be. Your TTFB stubbornly sits above 500 milliseconds. Your LCP will not drop below 2.5 seconds. Your PageSpeed score plateaus in the 60s or 70s no matter what you try.
The cause is that your hosting provider’s hardware, network, and infrastructure configuration have a performance ceiling, and your site has hit it. A server running SATA SSD instead of NVMe has a storage speed ceiling you cannot exceed with a plugin. A hosting plan with no CDN has a geographic latency ceiling you cannot lower with code minification. A shared server with 200 other accounts has a resource availability ceiling that drops during peak hours and no amount of caching prevents the baseline degradation.
No amount of WordPress optimisation can make a $2.99 host on HDD storage with no CDN and a congested shared server perform like NVMe infrastructure with a global CDN and dedicated resources. The ceiling is hardware. Plugins operate underneath that ceiling. When you have optimised everything under the ceiling and the site is still slow, the ceiling is the problem.
How to fix it: Switch to a hosting provider whose infrastructure does not impose the bottlenecks you are trying to optimise around. Webhost365 runs NVMe SSD storage on AMD EPYC Gen 4 processors with DDR5 RAM, includes Bunny CDN with 197 global edge locations on every plan, supports the latest PHP versions, and provides dedicated resources on cloud hosting plans starting at $3.49 per month. The $1.49 shared plan includes infrastructure that most providers reserve for their $10 to $15 premium tiers. The renewal price stays the same forever, so the plan you choose today costs the same in year three as it does in month one.
If you are evaluating whether your current hosting is the bottleneck, see our guide on what to look for in hosting for a small business or compare all Webhost365 plans side by side.
The “I already optimised everything” checklist
If you have worked through all five front-end causes and your site is still slow, your hosting infrastructure is the remaining variable. Before you start researching new providers, run through this five-point checklist to confirm exactly which infrastructure bottlenecks apply to your current hosting. Each check takes less than two minutes.
Check 1: Is your hosting using NVMe SSD?
Log into your hosting control panel or check your provider’s plan page for your current tier. Look for “NVMe” specifically. If the plan says “SSD” without specifying NVMe, it is almost certainly SATA SSD, which is 10x slower for random I/O operations. If the plan does not mention storage type at all, assume it is the cheapest option available. Contact support and ask directly: “What type of storage does my plan use — HDD, SATA SSD, or NVMe SSD?” If the answer is anything other than NVMe, your storage is a bottleneck. NVMe SSD delivers 0.02ms latency and over 1,000,000 random IOPS compared to 0.1ms and 90,000 IOPS for SATA SSD.
Check 2: Does your hosting include a CDN?
Check whether a CDN is active on your site, not just available as an add-on. Many providers list “CDN compatible” on their plan page, which means you can configure one yourself — it does not mean one is included. A CDN is included when it activates automatically with your hosting and costs nothing extra. If you need to sign up for Cloudflare separately, configure DNS records manually, or pay $5 to $15 per month for a CDN add-on, your hosting does not include a CDN. Without one, every visitor far from your server experiences 150 to 300 milliseconds of additional latency on every request.
Check 3: Do you have dedicated resources?
Check whether your hosting plan allocates specific CPU cores and RAM to your account, or whether you share a pool of resources with other accounts. If your plan page says “shared hosting,” you share resources. If your speed varies dramatically throughout the day — fast at 3 AM, slow at 3 PM — you are experiencing resource contention from neighbouring accounts. Cloud hosting with dedicated resources eliminates this variability because your allocation is reserved exclusively for your site.
Check 4: Is your PHP version 8.2 or higher?
Check your PHP version in your hosting control panel. If you are running PHP 7.4 or lower, you are leaving 20 to 30 percent of your WordPress performance on the table. Switching to PHP 8.2 or 8.3 is a one-click change in most control panels and takes effect within minutes. This is the one infrastructure fix you can make without changing providers, and it is worth doing regardless of what the other checks reveal.
Check 5: Does your renewal price stay the same?
Log into your hosting account and check what your plan will cost when it renews. If you signed up at $2.99 per month and your renewal rate is $9.99 or higher, your “affordable” hosting becomes expensive the moment your introductory term ends. This does not directly affect speed, but it affects how long you stay on infrastructure that may be underperforming. Many site owners tolerate slow hosting because they remember signing up for a low price and do not realise the price has tripled. Webhost365 charges the same price at renewal — $1.49 in month one is $1.49 in month thirty-six.
If three or more of these checks reveal problems, the most efficient fix is not five separate changes. It is one hosting migration. Moving to a provider that includes NVMe SSD, a global CDN, dedicated resources on cloud plans, current PHP versions, and stable pricing eliminates all five infrastructure bottlenecks simultaneously. Fixing them one at a time across different providers and add-on services costs more time and money than switching once to a platform that includes everything by default.
Fix the site first. Then fix the foundation.
Your website speed is the product of two layers. The top layer is what your site does — the images it loads, the scripts it runs, the fonts it downloads, the caching it uses. The bottom layer is what your hosting can handle — the storage speed, the network configuration, the resource allocation, the server hardware.
Start by fixing the top layer. Compress your images to WebP. Remove plugins you do not use. Minify your CSS and JavaScript. Enable server-side caching. Trim your fonts to two families. These five fixes are free, immediate, and typically cut 2 to 5 seconds off your page load time. For a detailed WordPress-specific walkthrough of every front-end optimisation, see our complete guide on how to speed up your WordPress site.
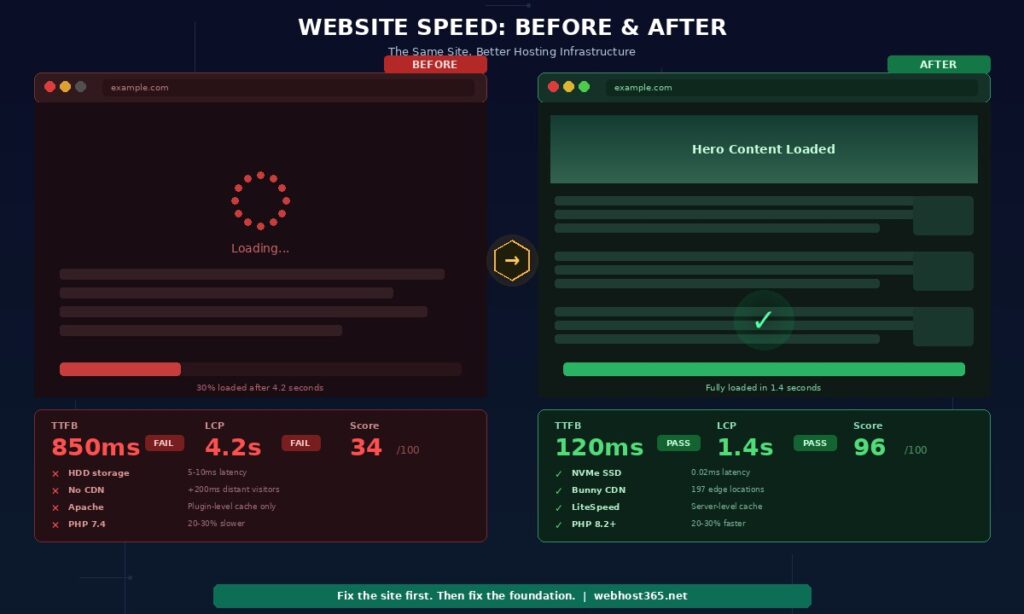
If the site is still slow after those fixes, the bottom layer is the problem. Move to hosting that runs on NVMe SSD with a global CDN, dedicated resources, and current PHP — all included by default, not gated behind premium plans or sold as add-ons. Every Webhost365 plan includes this infrastructure from $1.49 per month, with pricing that never changes at renewal.
General Hosting — from $1.49/mo | Cloud Hosting — from $3.49/mo | WordPress Hosting | Linux VPS — from $4.99/mo | Compare All Plans
Frequently asked questions
What is the most common cause of a slow website?
Unoptimised images are the single most common cause. Large image files that have not been compressed or converted to modern formats like WebP can add 1 to 5 seconds to every page load. A typical WordPress page with ten uncompressed JPEG images at 500 KB each downloads 5 MB of image data alone. Compressing those same images to 50 KB WebP files reduces the image payload by 90 percent and typically cuts 2 to 4 seconds off the load time. This is also the easiest fix — free WordPress plugins like ShortPixel or Imagify can automate compression and format conversion on upload without visible quality loss. Start with images before touching anything else because the impact-to-effort ratio is the highest of any speed fix available.
How do I know if my hosting is causing my slow website?
Check your Time to First Byte (TTFB) using Google PageSpeed Insights or GTmetrix. TTFB measures how quickly your server responds before any page content begins loading. If your TTFB is consistently above 600 milliseconds on uncached pages, the server is the bottleneck — not your images, plugins, or code. A fast hosting server on NVMe SSD with caching delivers TTFB under 200 milliseconds. If you have compressed your images, minified your code, enabled caching, updated PHP, and removed unnecessary plugins and your TTFB remains high, the problem is your hosting hardware. The fix at that point is better infrastructure, not more front-end optimisation.
Does hosting really affect website speed that much?
Yes. Hosting determines the speed floor underneath everything else you build. NVMe SSD storage retrieves data 10x faster than SATA SSD and 50x faster than HDD. A CDN reduces latency by 150 to 300 milliseconds for visitors far from your server. Dedicated server resources prevent your site from slowing down when neighbouring accounts experience traffic spikes. These infrastructure factors set the baseline. Your front-end optimisation — image compression, caching, code minification — determines how much faster you can go above that baseline. The best-optimised WordPress site on HDD hosting with no CDN will always be slower than a moderately optimised site on NVMe hosting with Bunny CDN. The infrastructure ceiling matters more than the optimisation effort beneath it.
Will a CDN fix my slow website?
A CDN fixes the geographic component of slow loading — the delay caused by physical distance between your server and your visitors. If your site loads fast for visitors near your server but slow for visitors in other regions or countries, a CDN will make a dramatic difference by caching your static content on edge servers closer to every visitor. However, a CDN does not fix server-side slowness. If your TTFB is high because of slow storage hardware or an overloaded shared server, the CDN caches and delivers that slowly-generated content faster globally, but the origin page generation is still slow for uncached requests. For the best results, combine NVMe hosting for fast origin response with a CDN for fast global delivery. On Webhost365, Bunny CDN with 197 edge locations is included free on every plan, so both layers work together from day one.
How fast should my website load?
Google considers a Largest Contentful Paint of 2.5 seconds or less as “good” for Core Web Vitals. An Interaction to Next Paint of 200 milliseconds or less is considered “good.” Pages meeting both thresholds receive a positive ranking signal in Google search results. For practical user experience, your full page should be usable within 3 seconds on a mobile connection. Time to First Byte should be under 200 milliseconds on cached pages and under 600 milliseconds on uncached pages. Total page weight should ideally be under 2 MB. These targets are achievable for most WordPress sites on NVMe hosting with a CDN, proper image compression, and server-side caching enabled.
Can I fix a slow website without changing hosting providers?
Often, yes. The five front-end causes — unoptimised images, excess plugins, render-blocking code, missing caching, and heavy fonts — are fixable on any hosting provider and typically produce the largest speed improvements. Start there. Compress your images to WebP, remove plugins you do not actively use, enable a caching plugin, minify CSS and JavaScript, and limit your fonts to two families at two weights. These changes typically cut 2 to 5 seconds off page load time on any server. However, if your TTFB remains above 600 milliseconds after completing all five front-end fixes, the problem is your hosting infrastructure — slow storage, no CDN, shared resources, or outdated hardware — and no amount of front-end optimisation can compensate for a server that is fundamentally too slow. At that point, switching to a faster host with NVMe SSD, a global CDN, and dedicated resources is the only remaining fix that moves the needle.